Key Facts
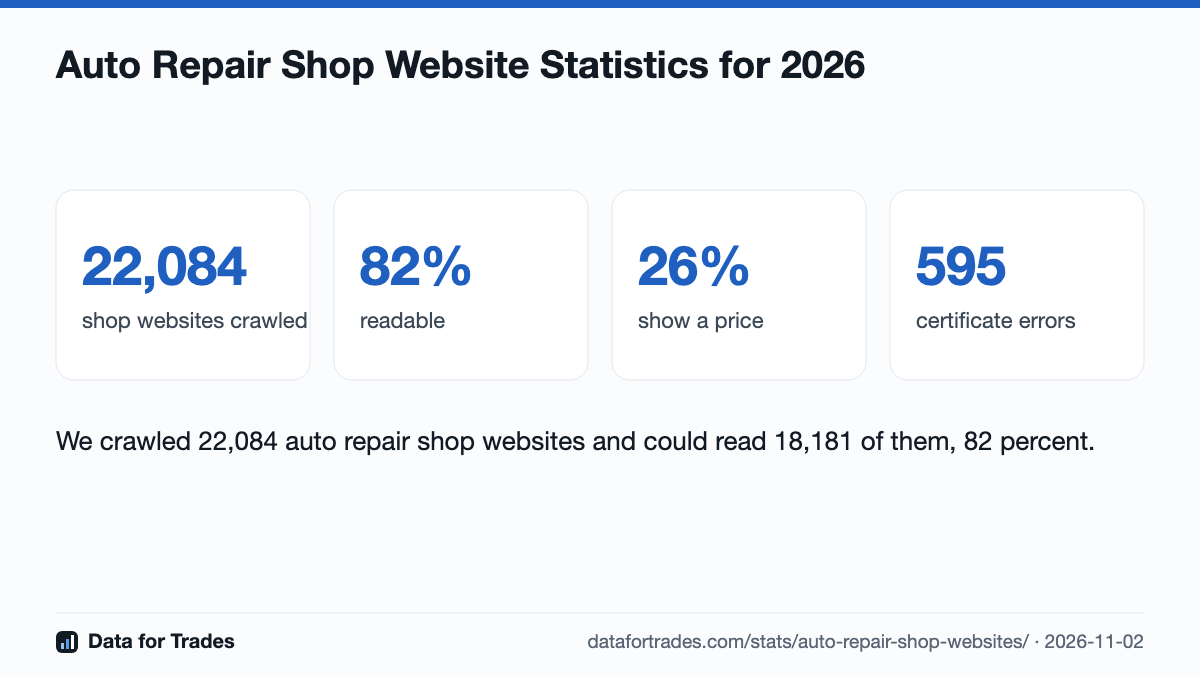
We crawled 22,084 auto repair shop websites and could read 18,181 of them, 82 percent.
We crawled 22,084 auto repair shop websites and could read 18,181 of them, 82 percent. Source Data for Trades, https://datafortrades.com/stats/auto-repair-shop-websites/4,650 shop websites show at least one price, 26 percent of the sites we could read.
4,650 shop websites show at least one price, 26 percent of the sites we could read. Source Data for Trades, https://datafortrades.com/stats/auto-repair-shop-websites/595 shop websites failed on a security certificate or TLS error, so a browser shows the customer a warning before the page.
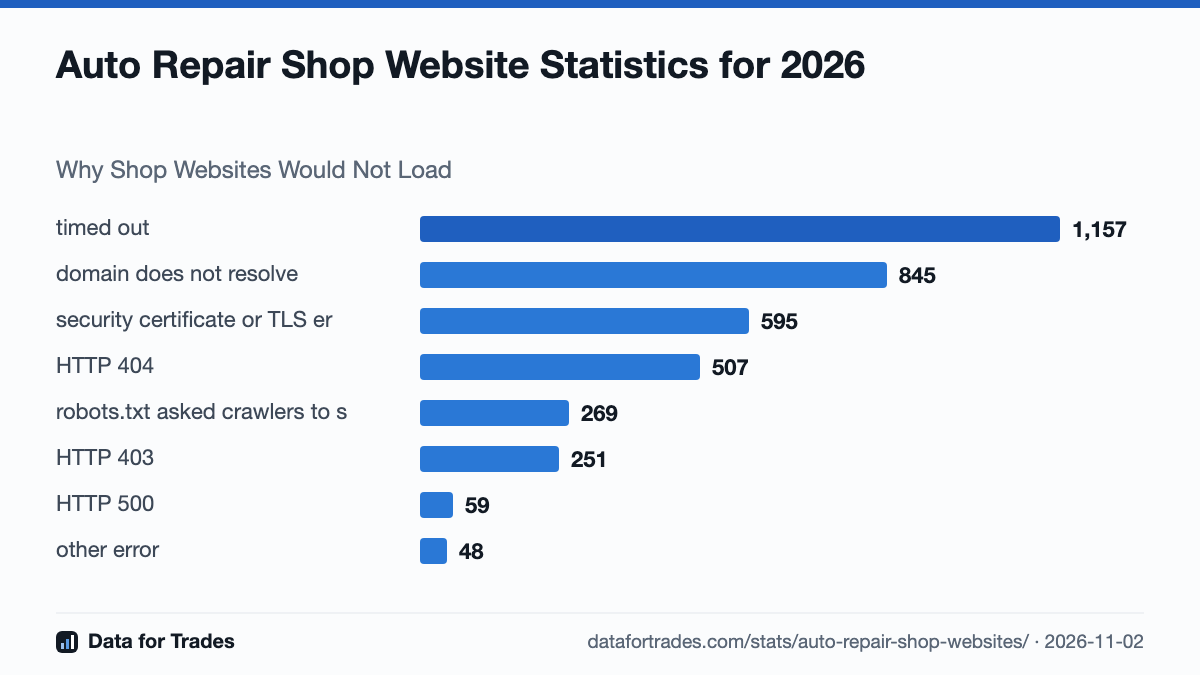
595 shop websites failed on a security certificate or TLS error, so a browser shows the customer a warning before the page. Source Data for Trades, https://datafortrades.com/stats/auto-repair-shop-websites/The most common reason a shop site would not load was a timeout, on 1,157 sites. A domain that no longer resolves came next with 845.
The most common reason a shop site would not load was a timeout, on 1,157 sites. A domain that no longer resolves came next with 845. Source Data for Trades, https://datafortrades.com/stats/auto-repair-shop-websites/845 shops still list a website whose domain no longer resolves at all.
845 shops still list a website whose domain no longer resolves at all. Source Data for Trades, https://datafortrades.com/stats/auto-repair-shop-websites/1,189 shop sites sit on a site builder or vendor host instead of their own domain. Wix leads with 243.
1,189 shop sites sit on a site builder or vendor host instead of their own domain. Wix leads with 243. Source Data for Trades, https://datafortrades.com/stats/auto-repair-shop-websites/Washington shops are the most likely to post a price, at 32.5 percent of readable sites.
Washington shops are the most likely to post a price, at 32.5 percent of readable sites. Source Data for Trades, https://datafortrades.com/stats/auto-repair-shop-websites/
Table view
| Item | Sites | Share |
|---|---|---|
| timed out | 1,157 | 31.0% |
| domain does not resolve | 845 | 22.6% |
| security certificate or TLS error | 595 | 15.9% |
| HTTP 404 | 507 | 13.6% |
| robots.txt asked crawlers to stay out | 269 | 7.2% |
| HTTP 403 | 251 | 6.7% |
| HTTP 500 | 59 | 1.6% |
| other error | 48 | 1.3% |
Table view
| Item | Percent of sites | Share |
|---|---|---|
| Washington | 32.5 | 4.3% |
| Iowa | 30.2 | 4.0% |
| Utah | 28.7 | 3.8% |
| California | 28.4 | 3.7% |
| Virginia | 28.0 | 3.7% |
| Georgia | 27.7 | 3.6% |
| Alabama | 27.4 | 3.6% |
| Wisconsin | 26.4 | 3.5% |
| Arizona | 26.3 | 3.4% |
| Michigan | 26.0 | 3.4% |
| Kansas | 25.7 | 3.4% |
| Massachusetts | 25.5 | 3.3% |
| Tennessee | 24.9 | 3.3% |
| Illinois | 24.8 | 3.2% |
| Oklahoma | 24.6 | 3.2% |
| North Carolina | 24.5 | 3.2% |
| Colorado | 24.5 | 3.2% |
| Texas | 24.2 | 3.2% |
| Minnesota | 24.2 | 3.2% |
| Oregon | 24.2 | 3.2% |
| Kentucky | 23.4 | 3.1% |
| Florida | 22.8 | 3.0% |
| Indiana | 22.5 | 2.9% |
| Maryland | 22.5 | 2.9% |
| New York | 22.3 | 2.9% |
| Ohio | 21.8 | 2.9% |
| South Carolina | 20.6 | 2.7% |
| Louisiana | 20.5 | 2.7% |
| Missouri | 19.8 | 2.6% |
| New Jersey | 19.6 | 2.6% |
| Pennsylvania | 19.2 | 2.5% |
Why Shop Websites Would Not Load
| Rank | Name | Sites |
|---|---|---|
| 1 | timed out | 1,157 |
| 2 | domain does not resolve | 845 |
| 3 | security certificate or TLS error | 595 |
| 4 | HTTP 404 | 507 |
| 5 | robots.txt asked crawlers to stay out | 269 |
| 6 | HTTP 403 | 251 |
| 7 | HTTP 500 | 59 |
| 8 | other error | 48 |
States Where Shops Most Often Post a Price
| Rank | Name | Percent of sites |
|---|---|---|
| 1 | Washington | 32.5 |
| 2 | Iowa | 30.2 |
| 3 | Utah | 28.7 |
| 4 | California | 28.4 |
| 5 | Virginia | 28.0 |
| 6 | Georgia | 27.7 |
| 7 | Alabama | 27.4 |
| 8 | Wisconsin | 26.4 |
| 9 | Arizona | 26.3 |
| 10 | Michigan | 26.0 |
| 11 | Kansas | 25.7 |
| 12 | Massachusetts | 25.5 |
| 13 | Tennessee | 24.9 |
| 14 | Illinois | 24.8 |
| 15 | Oklahoma | 24.6 |
Site Builders and Vendor Hosts
| Rank | Name | Sites |
|---|---|---|
| 1 | Wix | 243 |
| 2 | edan.io | 119 |
| 3 | Square Online | 116 |
| 4 | jany.io | 97 |
| 5 | keeq.io | 80 |
| 6 | GoDaddy | 78 |
| 7 | AI site builder | 77 |
| 8 | Developer hosting | 59 |
| 9 | poi.place | 47 |
| 10 | ueniweb.com | 43 |
| 11 | Canva | 42 |
| 12 | WordPress.com | 30 |
Infographics You Can Use
How We Counted
- One crawl of each listed shop website, home page plus up to four inner pages.
- A site counts as readable when at least one page returned text.
- State shares use states with enough sites to be stable.
Sources
- Auto Shop Websites, from Clickflame shop website crawl, updated 2026-10-30
- Auto Shop Website Health by State, from Clickflame shop website crawl, updated 2026-10-30
Cite This Page
Data for Trades, "Auto Repair Shop Website Statistics for 2026," 2026-11-02, https://datafortrades.com/stats/auto-repair-shop-websites/