Key Facts
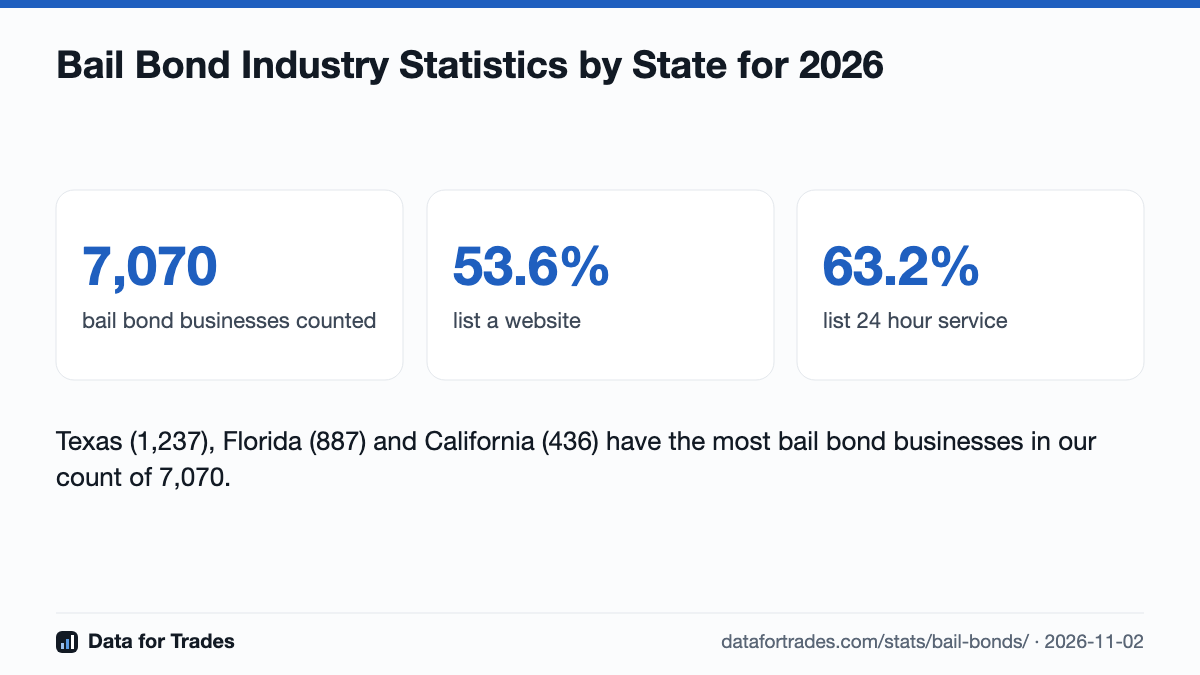
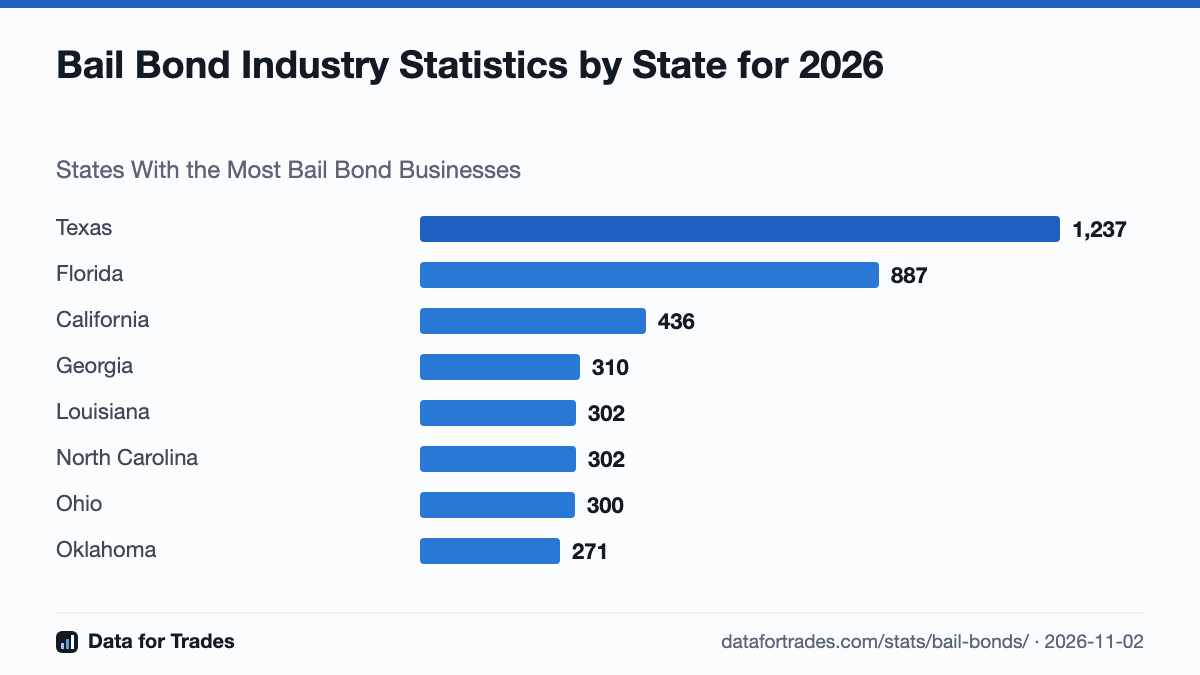
Texas (1,237), Florida (887) and California (436) have the most bail bond businesses in our count of 7,070.
Texas (1,237), Florida (887) and California (436) have the most bail bond businesses in our count of 7,070. Source Data for Trades, https://datafortrades.com/stats/bail-bonds/The top 3 states hold 36 percent of all bail bond businesses we counted.
The top 3 states hold 36 percent of all bail bond businesses we counted. Source Data for Trades, https://datafortrades.com/stats/bail-bonds/Jacksonville, FL is the single largest city for bail bond businesses, with 79.
Jacksonville, FL is the single largest city for bail bond businesses, with 79. Source Data for Trades, https://datafortrades.com/stats/bail-bonds/53.6 percent of bail bond businesses list a website on their public business profile, so about 46 in 100 still have none.
53.6 percent of bail bond businesses list a website on their public business profile, so about 46 in 100 still have none. Source Data for Trades, https://datafortrades.com/stats/bail-bonds/63.2 percent of bail bond businesses say they are open or answer 24 hours.
63.2 percent of bail bond businesses say they are open or answer 24 hours. Source Data for Trades, https://datafortrades.com/stats/bail-bonds/We also mapped 1,822 jails and detention centers alongside them.
We also mapped 1,822 jails and detention centers alongside them. Source Data for Trades, https://datafortrades.com/stats/bail-bonds/
Table view
| Item | Bail bond businesses | Share |
|---|---|---|
| Texas | 1,237 | 17.6% |
| Florida | 887 | 12.7% |
| California | 436 | 6.2% |
| Georgia | 310 | 4.4% |
| Louisiana | 302 | 4.3% |
| North Carolina | 302 | 4.3% |
| Ohio | 300 | 4.3% |
| Oklahoma | 271 | 3.9% |
| Tennessee | 264 | 3.8% |
| Alabama | 246 | 3.5% |
| Missouri | 217 | 3.1% |
| South Carolina | 182 | 2.6% |
| Mississippi | 163 | 2.3% |
| Virginia | 162 | 2.3% |
| Maryland | 162 | 2.3% |
| Connecticut | 159 | 2.3% |
| Arkansas | 133 | 1.9% |
| Pennsylvania | 133 | 1.9% |
| Michigan | 114 | 1.6% |
| New Jersey | 111 | 1.6% |
| Indiana | 99 | 1.4% |
| Kansas | 98 | 1.4% |
| New York | 89 | 1.3% |
| Minnesota | 85 | 1.2% |
| Colorado | 85 | 1.2% |
| Nevada | 73 | 1.0% |
| Iowa | 68 | 1.0% |
| Utah | 62 | 0.9% |
| Washington | 59 | 0.8% |
| West Virginia | 54 | 0.8% |
| Idaho | 54 | 0.8% |
| Montana | 42 | 0.6% |
| Arizona | 27 | 0.4% |
| Delaware | 25 | 0.4% |
Table view
| Item | Bail bond businesses | Share |
|---|---|---|
| Jacksonville, FL | 79 | 6.9% |
| Houston, TX | 78 | 6.8% |
| Oklahoma City, OK | 65 | 5.6% |
| Tampa, FL | 63 | 5.5% |
| Los Angeles, CA | 56 | 4.9% |
| Miami, FL | 54 | 4.7% |
| San Antonio, TX | 51 | 4.4% |
| Baltimore, MD | 50 | 4.3% |
| Las Vegas, NV | 48 | 4.2% |
| Shreveport, LA | 43 | 3.7% |
| Orlando, FL | 40 | 3.5% |
| Cleveland, OH | 35 | 3.0% |
| Fort Myers, FL | 33 | 2.9% |
| Dallas, TX | 31 | 2.7% |
| Fort Lauderdale, FL | 31 | 2.7% |
| Sacramento, CA | 31 | 2.7% |
| Santa Ana, CA | 31 | 2.7% |
| Fort Worth, TX | 30 | 2.6% |
| Wichita, KS | 30 | 2.6% |
| Riverside, CA | 29 | 2.5% |
| San Diego, CA | 29 | 2.5% |
| Atlanta, GA | 28 | 2.4% |
| Baton Rouge, LA | 26 | 2.3% |
| Tulsa, OK | 25 | 2.2% |
| Fort Pierce, FL | 25 | 2.2% |
| Clearwater, FL | 23 | 2.0% |
| West Palm Beach, FL | 23 | 2.0% |
| El Paso, TX | 22 | 1.9% |
| Brownsville, TX | 22 | 1.9% |
| Raleigh, NC | 22 | 1.9% |
States With the Most Bail Bond Businesses
| Rank | Name | Bail bond businesses |
|---|---|---|
| 1 | Texas | 1,237 |
| 2 | Florida | 887 |
| 3 | California | 436 |
| 4 | Georgia | 310 |
| 5 | Louisiana | 302 |
| 6 | North Carolina | 302 |
| 7 | Ohio | 300 |
| 8 | Oklahoma | 271 |
| 9 | Tennessee | 264 |
| 10 | Alabama | 246 |
| 11 | Missouri | 217 |
| 12 | South Carolina | 182 |
| 13 | Mississippi | 163 |
| 14 | Virginia | 162 |
| 15 | Maryland | 162 |
Largest Cities for Bail Bond Businesses
| Rank | Name | Bail bond businesses |
|---|---|---|
| 1 | Jacksonville, FL | 79 |
| 2 | Houston, TX | 78 |
| 3 | Oklahoma City, OK | 65 |
| 4 | Tampa, FL | 63 |
| 5 | Los Angeles, CA | 56 |
| 6 | Miami, FL | 54 |
| 7 | San Antonio, TX | 51 |
| 8 | Baltimore, MD | 50 |
| 9 | Las Vegas, NV | 48 |
| 10 | Shreveport, LA | 43 |
| 11 | Orlando, FL | 40 |
| 12 | Cleveland, OH | 35 |
| 13 | Fort Myers, FL | 33 |
| 14 | Dallas, TX | 31 |
| 15 | Fort Lauderdale, FL | 31 |
Infographics You Can Use
How We Counted
- Counts come from jailbails.com and bailbondsperson.com directory checks, state licensing pages and California county courts.
- A state, city or metro is shown only with 15 or more businesses.
- Shares are of all businesses counted.
Sources
- Bail Bond Businesses and Jails by State, from jailbails.com and bailbondsperson.com directory checks, state licensing pages and California county courts, updated 2026-11-01
Cite This Page
Data for Trades, "Bail Bond Industry Statistics by State for 2026," 2026-11-02, https://datafortrades.com/stats/bail-bonds/