Key Facts
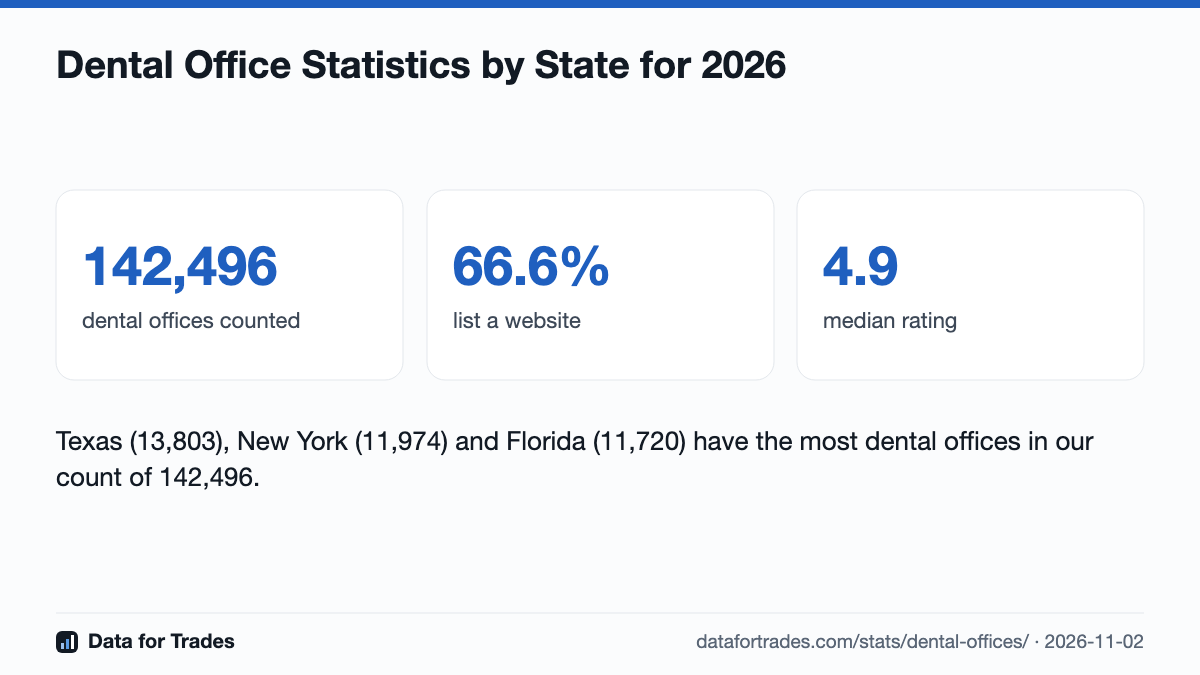
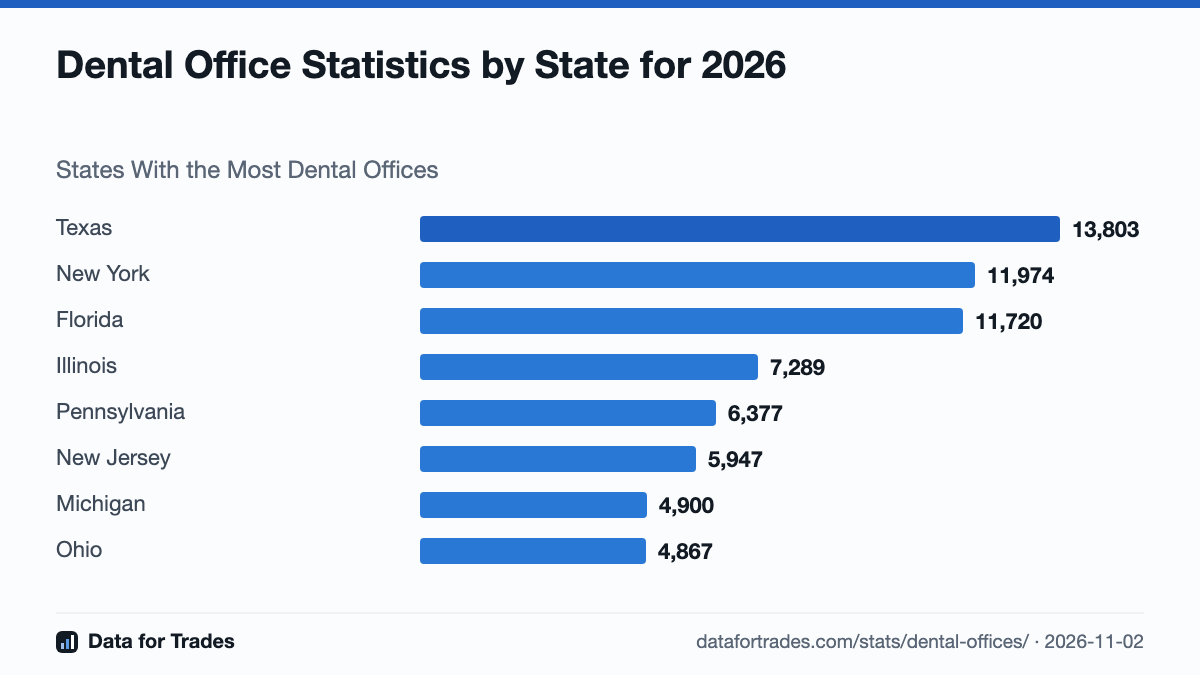
Texas (13,803), New York (11,974) and Florida (11,720) have the most dental offices in our count of 142,496.
Texas (13,803), New York (11,974) and Florida (11,720) have the most dental offices in our count of 142,496. Source Data for Trades, https://datafortrades.com/stats/dental-offices/The top 3 states hold 26 percent of all dental offices we counted.
The top 3 states hold 26 percent of all dental offices we counted. Source Data for Trades, https://datafortrades.com/stats/dental-offices/Per person, District of Columbia has the most dental offices, 68.6 per 100,000 residents. Delaware has the fewest of the states with 15 or more, at 32.0.
Per person, District of Columbia has the most dental offices, 68.6 per 100,000 residents. Delaware has the fewest of the states with 15 or more, at 32.0. Source Data for Trades, https://datafortrades.com/stats/dental-offices/New York, NY is the single largest city for dental offices, with 2,419.
New York, NY is the single largest city for dental offices, with 2,419. Source Data for Trades, https://datafortrades.com/stats/dental-offices/66.6 percent of dental offices list a website on their public business profile, so about 33 in 100 still have none.
66.6 percent of dental offices list a website on their public business profile, so about 33 in 100 still have none. Source Data for Trades, https://datafortrades.com/stats/dental-offices/The median public star rating for dental offices is 4.9.
The median public star rating for dental offices is 4.9. Source Data for Trades, https://datafortrades.com/stats/dental-offices/30.1 percent of dental offices list payment plans on their public profile.
30.1 percent of dental offices list payment plans on their public profile. Source Data for Trades, https://datafortrades.com/stats/dental-offices/
Table view
| Item | Dental offices | Share |
|---|---|---|
| Texas | 13,803 | 9.7% |
| New York | 11,974 | 8.4% |
| Florida | 11,720 | 8.2% |
| Illinois | 7,289 | 5.1% |
| Pennsylvania | 6,377 | 4.5% |
| New Jersey | 5,947 | 4.2% |
| Michigan | 4,900 | 3.4% |
| Ohio | 4,867 | 3.4% |
| Georgia | 4,438 | 3.1% |
| North Carolina | 4,337 | 3.0% |
| Virginia | 4,279 | 3.0% |
| Washington | 4,071 | 2.9% |
| Massachusetts | 3,940 | 2.8% |
| Maryland | 3,446 | 2.4% |
| Arizona | 3,403 | 2.4% |
| Colorado | 3,155 | 2.2% |
| Tennessee | 3,067 | 2.2% |
| Indiana | 2,941 | 2.1% |
| Missouri | 2,620 | 1.8% |
| Wisconsin | 2,424 | 1.7% |
| Minnesota | 2,404 | 1.7% |
| Connecticut | 2,248 | 1.6% |
| South Carolina | 2,247 | 1.6% |
| Oregon | 2,174 | 1.5% |
| Louisiana | 2,066 | 1.4% |
| Kentucky | 1,970 | 1.4% |
| Alabama | 1,859 | 1.3% |
| Utah | 1,799 | 1.3% |
| Oklahoma | 1,729 | 1.2% |
| Nevada | 1,581 | 1.1% |
| Iowa | 1,241 | 0.9% |
| Kansas | 1,214 | 0.9% |
| Arkansas | 1,166 | 0.8% |
| Mississippi | 1,080 | 0.8% |
| Nebraska | 914 | 0.6% |
| Idaho | 888 | 0.6% |
| New Mexico | 852 | 0.6% |
| Hawaii | 847 | 0.6% |
| West Virginia | 682 | 0.5% |
| New Hampshire | 640 | 0.4% |
| Maine | 573 | 0.4% |
| Montana | 539 | 0.4% |
| District of Columbia | 482 | 0.3% |
| Rhode Island | 440 | 0.3% |
| Alaska | 369 | 0.3% |
| Delaware | 337 | 0.2% |
| South Dakota | 327 | 0.2% |
| North Dakota | 306 | 0.2% |
| Wyoming | 264 | 0.2% |
| Vermont | 260 | 0.2% |
Table view
| Item | Per 100,000 residents | Share |
|---|---|---|
| District of Columbia | 68.6 | 3.0% |
| New Jersey | 62.6 | 2.7% |
| Connecticut | 61.2 | 2.7% |
| New York | 60.3 | 2.6% |
| Hawaii | 58.6 | 2.6% |
| Illinois | 57.3 | 2.5% |
| Massachusetts | 55.2 | 2.4% |
| Maryland | 55.0 | 2.4% |
| Colorado | 53.0 | 2.3% |
| Utah | 51.3 | 2.2% |
| Washington | 51.2 | 2.2% |
| Oregon | 50.9 | 2.2% |
| Florida | 50.1 | 2.2% |
| Alaska | 49.9 | 2.2% |
| Pennsylvania | 48.8 | 2.1% |
| Virginia | 48.6 | 2.1% |
| Nevada | 48.4 | 2.1% |
| Michigan | 48.3 | 2.1% |
| Montana | 47.4 | 2.1% |
| Nebraska | 45.6 | 2.0% |
| New Hampshire | 45.4 | 2.0% |
| Arizona | 44.9 | 2.0% |
| Louisiana | 44.9 | 2.0% |
| Wyoming | 44.9 | 2.0% |
| Idaho | 44.4 | 1.9% |
| Texas | 44.1 | 1.9% |
| Kentucky | 42.9 | 1.9% |
| Indiana | 42.5 | 1.9% |
| Tennessee | 42.4 | 1.9% |
| Oklahoma | 42.2 | 1.8% |
| Missouri | 42.0 | 1.8% |
| Minnesota | 41.5 | 1.8% |
| Ohio | 41.0 | 1.8% |
| South Carolina | 41.0 | 1.8% |
| Kansas | 40.9 | 1.8% |
| Maine | 40.8 | 1.8% |
| Wisconsin | 40.7 | 1.8% |
| Vermont | 40.1 | 1.8% |
| New Mexico | 40.0 | 1.7% |
| Georgia | 39.7 | 1.7% |
| Rhode Island | 39.6 | 1.7% |
| North Carolina | 39.3 | 1.7% |
| West Virginia | 38.5 | 1.7% |
| North Dakota | 38.4 | 1.7% |
| Iowa | 38.3 | 1.7% |
| Arkansas | 37.8 | 1.7% |
| Mississippi | 36.7 | 1.6% |
| Alabama | 36.0 | 1.6% |
| South Dakota | 35.4 | 1.5% |
| Delaware | 32.0 | 1.4% |
States With the Most Dental Offices
| Rank | Name | Dental offices |
|---|---|---|
| 1 | Texas | 13,803 |
| 2 | New York | 11,974 |
| 3 | Florida | 11,720 |
| 4 | Illinois | 7,289 |
| 5 | Pennsylvania | 6,377 |
| 6 | New Jersey | 5,947 |
| 7 | Michigan | 4,900 |
| 8 | Ohio | 4,867 |
| 9 | Georgia | 4,438 |
| 10 | North Carolina | 4,337 |
| 11 | Virginia | 4,279 |
| 12 | Washington | 4,071 |
| 13 | Massachusetts | 3,940 |
| 14 | Maryland | 3,446 |
| 15 | Arizona | 3,403 |
Dental Offices per 100,000 Residents by State
| Rank | Name | Per 100,000 residents |
|---|---|---|
| 1 | District of Columbia | 68.6 |
| 2 | New Jersey | 62.6 |
| 3 | Connecticut | 61.2 |
| 4 | New York | 60.3 |
| 5 | Hawaii | 58.6 |
| 6 | Illinois | 57.3 |
| 7 | Massachusetts | 55.2 |
| 8 | Maryland | 55.0 |
| 9 | Colorado | 53.0 |
| 10 | Utah | 51.3 |
| 11 | Washington | 51.2 |
| 12 | Oregon | 50.9 |
| 13 | Florida | 50.1 |
| 14 | Alaska | 49.9 |
| 15 | Pennsylvania | 48.8 |
Largest Cities for Dental Offices
| Rank | Name | Dental offices |
|---|---|---|
| 1 | New York, NY | 2,419 |
| 2 | Houston, TX | 1,890 |
| 3 | Chicago, IL | 1,625 |
| 4 | Brooklyn, NY | 1,220 |
| 5 | San Antonio, TX | 933 |
| 6 | Miami, FL | 915 |
| 7 | Las Vegas, NV | 877 |
| 8 | Dallas, TX | 777 |
| 9 | Philadelphia, PA | 709 |
| 10 | Austin, TX | 676 |
| 11 | Phoenix, AZ | 653 |
| 12 | Charlotte, NC | 569 |
| 13 | Atlanta, GA | 550 |
| 14 | Indianapolis, IN | 550 |
| 15 | Seattle, WA | 540 |
Dental Offices by Provider Type
| Rank | Name | Offices |
|---|---|---|
| 1 | Dentist | 126,300 |
| 2 | Dental clinic | 3,150 |
| 3 | Pediatric dentist | 2,562 |
| 4 | Orthodontist | 2,456 |
| 5 | Cosmetic dentist | 1,688 |
| 6 | Oral surgeon | 1,014 |
| 7 | Endodontist | 896 |
| 8 | Other dental providers | 804 |
| 9 | Dental implants provider | 693 |
| 10 | Dental implants periodontist | 687 |
| 11 | Medical clinic | 528 |
| 12 | Periodontist | 385 |
Infographics You Can Use
How We Counted
- Counts come from FreeDentalOffice directory checks of Google listings and HRSA health center sites, aggregated.
- A state, city or metro is shown only with 15 or more businesses.
- Per person figures use the US Census Bureau 2024 state population estimates.
Sources
- Dental Offices by State and City, from FreeDentalOffice directory checks of Google listings and HRSA health center sites, aggregated, updated 2026-09-30
Cite This Page
Data for Trades, "Dental Office Statistics by State for 2026," 2026-11-02, https://datafortrades.com/stats/dental-offices/